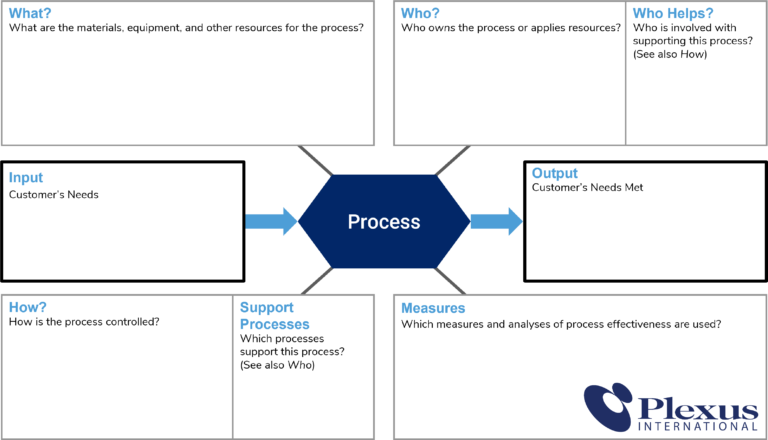
The Turtle Diagram is a tool commonly used by organizations as a proven way to define processes. It is also a useful tool for auditors conducting a management system or process audit, including manufacturing or quality process. If used correctly in the planning process, the Turtle Diagram process can assist the auditor to do the following:
Identify relevant sources of risk
Address performance, highlighting those sources that influence the MEASURE of the process
Trace WHERE the outputs of the process go, and what INPUTS the process uses
Perform the audit, using the tool to collect relevant auditor evidence to support findings
Perform the audit to trace OUTPUTS of the process into other areas of the system
The Turtle Diagram is the framework for defining the following components of a process:
Process name: What is the name of the process (normally expressed as an action; suggest using a verb for the name of the process)? Examples might include Marketing, Ordering, Manufacturing, Auditing, Management Review, etc.
Inputs: What is the customer need that this process will fill? Define this need at the characteristic level. Include any regulatory and statutory requirements. Does the standard specify any requirements as inputs for this process?
Outputs: Has the customer’s need been met? How will you know that the characteristics required in the input have been achieved? This will help lead to what you measure.
What: What are the resources for the process (materials, equipment, buildings, hardware/software, etc.)?
Who (Owners): Who are the individuals applying the resources? Who is the process owner and who are the individuals operating with-in the process? List the Process Owner and some process personnel.
Who (Supporters): Who are the individuals involved in supporting this process? Refer to the “How” box and link to supporting processes. Examples might include HR, Cleaning staff, Facilities and Equipment Maintenance, IT, etc. (List 2 or 3).
How (Process Control): How is this process controlled (procedures, sub-processes)? Which processes support this process?
How (Supporting Processes): What are the supporting processes. Examples might include training, housekeeping, facilities maintenance, equipment maintenance, etc. This will also help with the “Who is involved part” of the “Who” box (List 2 or 3).
Measures: Which measures are used for analysis of process effectiveness (measures and metrics, use of data)?
Focus on Performance
Once you have added a few items in each box of the turtle diagram, you will have a general overview of the process. Next return to the Measurement box and drill down to see how the process is performing. This drill down will take you back to many of the other boxes to investigate records to show the objective evidence of how the process is performing, focusing on Performance.
If the performance of the process is good and seems well-defined and working as intended by management, stop drilling down and move to another process that does not seem to have acceptable performance.
The new draft 1st Edition AIAG & VDA SPC Manual has been released!
The AIAG SPC Manual (Draft Edition) is on the horizon—and if you are responsible for process control, capability, or quality system performance, this update may directly impact you.
Sign up today to receive expert updates on the AIAG SPC Manual Draft and ensure you are ready when the new edition becomes the industry expectation.